Example Q5: Experiment Sweeps
This example notebook shows how to add sweeps to Auspex qubit experiments
© Raytheon BBN Technologies 2018
[1]:
import auspex.config as config
config.auspex_dummy_mode = True
[2]:
from QGL import *
from auspex.qubit import *
AWG_DIR environment variable not defined. Unless otherwise specified, using temporary directory for AWG sequence file outputs.
auspex-WARNING: 2019-04-02 14:33:37,114 ----> Could not load channelizer library; falling back to python methods.
Channel library setup
[3]:
cl = ChannelLibrary(":memory:")
pl = PipelineManager()

q1 = cl.new_qubit("q1")
aps2_1 = cl.new_APS2("BBNAPSa", address="192.168.2.4", trigger_interval=200e-6)
aps2_2 = cl.new_APS2("BBNAPSb", address="192.168.2.2")
dig_1  = cl.new_Alazar("Alazar_1", address="1", sampling_rate=500e6, record_length=1024)
h1 = cl.new_source("Holz_1", "HolzworthHS9000", "HS9004A-009-1", reference='10MHz', power=-30)
h2 = cl.new_source("Holz_2", "HolzworthHS9000", "HS9004A-009-2", reference='10MHz', power=-30)

cl.set_measure(q1, aps2_1, dig_1.ch("1"), trig_channel=aps2_1.ch("m2"), gate=False, generator=h1)
cl.set_control(q1, aps2_2, generator=h2)
cl.set_master(aps2_1, aps2_1.ch("m1"))
cl["q1"].measure_chan.frequency = 0e6
cl["q1"].measure_chan.autodyne_freq = 10e6
auspex-INFO: 2019-04-02 14:33:37,563 ----> Could not find an existing pipeline. Please create one.
Pipeline setup: Take Note: we use the buffers keyword argument to automatically generate buffers instead of writers. This is sometimes convenient if you don’t require data to be written to file. It becomes immediately available in the notebook after running!
[ ]:
pl.create_default_pipeline(buffers=True)
pl["q1"].add(Display(label="blub"))
pl["q1"]["Demodulate"]["Integrate"].add(Display(label="int", plot_dims=1))
pl.show_pipeline()

Initialize software demodulation parameters. If these are not properly configured than the Channelizer filter will report ‘insufficient decimation’ or other errors. The integration boxcar parameters are then defined.
[14]:
demod = pl["q1"]["Demodulate"]
demod.frequency = cl["q1"].measure_chan.frequency
demod.decimation_factor = 16
[15]:
integ = pl["q1"]["Demodulate"]["Integrate"]
integ.box_car_start = 0.2e-6
integ.box_car_stop= 1.9e-6
Adding experiment sweeps
Once a QubitExperiment has been created, we can programmatically add sweeps as shown here.
[ ]:
lengths = np.linspace(20e-9, 2020e-9, 31)
exp = QubitExperiment(RabiWidth(q1,lengths),averages=50)
exp.set_fake_data(dig_1, np.exp(-lengths/1e-6)*np.cos(1e7*lengths))
# exp.add_qubit_sweep(q1,"measure", "frequency", np.linspace(6.512e9, 6.522e9, 11))
exp.run_sweeps()

We fetch the data and data descriptor directly from the buffer. The data is automatically reshaped to match the experiment axes, and the descriptor enumerates all of the values of these axes for convenience plotting, etc..
[21]:
data, descriptor = exp.outputs_by_qubit["q1"][0].get_data()
[22]:
descriptor.axes
[22]:
[<SweepAxis(name=q1 measure frequency,length=11,unit=None,value=6522000000.0,unstructured=False>,
 <DataAxis(name=delay, start=0.02, stop=2.02, num=21, unit=us)>]
[23]:
data.shape
[23]:
(11, 21)
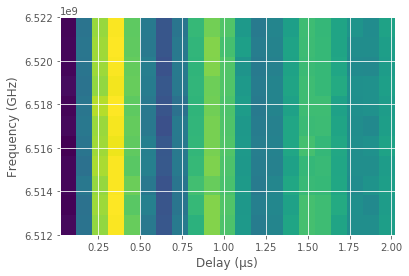
We even include a convenience extent function conforming to the infinitely forgettable matplotlib format.
[24]:
import matplotlib.pyplot as plt
%matplotlib inline

plt.imshow(np.real(data), aspect='auto', extent=descriptor.extent())
plt.xlabel("Delay (µs)")
plt.ylabel("Frequency (GHz)");
Adding Multiple Sweeps
An arbitrary number of sweeps can be added. For example:
[25]:
exp = QubitExperiment(RabiWidth(q1,lengths),averages=50)
exp.add_qubit_sweep(q1,"measure", "frequency", np.linspace(6.512e9, 6.522e9, 5))
exp.add_qubit_sweep(q1,"measure", "amplitude", np.linspace(0.0, 1.0, 21))
Compiled 21 sequences.
If we inspect the internal representation of the “output connector” into which the instrument driver will dump its data, we can see all of the axes it contains.
[26]:
exp.output_connectors["q1"].descriptor.axes
[26]:
[<SweepAxis(name=q1 measure amplitude,length=21,unit=None,value=0.0,unstructured=False>,
 <SweepAxis(name=q1 measure frequency,length=5,unit=None,value=6512000000.0,unstructured=False>,
 <DataAxis(name=averages, start=0, stop=49, num=50, unit=None)>,
 <DataAxis(name=delay, start=0.02, stop=2.02, num=21, unit=us)>,
 <DataAxis(name=time, start=0.0, stop=2.046e-06, num=1024, unit=None)>]
The DataAxis entries are “baked in” using hardware looping, while the SweepAxis entries are external software loops facilitated by Auspex.